Key Requirements and Configuration Checks
- Calculate torque only from power at the same operating point.
- Keep continuous output distinct from cyclic-duty output.
- Match winding, frequency, cooling and machine requirements together.
Match the proposed configuration to its applicable drawing, operating data and machine requirements. Resolve mounting dimensions, auxiliary services and operating limits before accepting a spindle for the intended installation.
| Drawing example | Interpretation | Selection consequence |
|---|---|---|
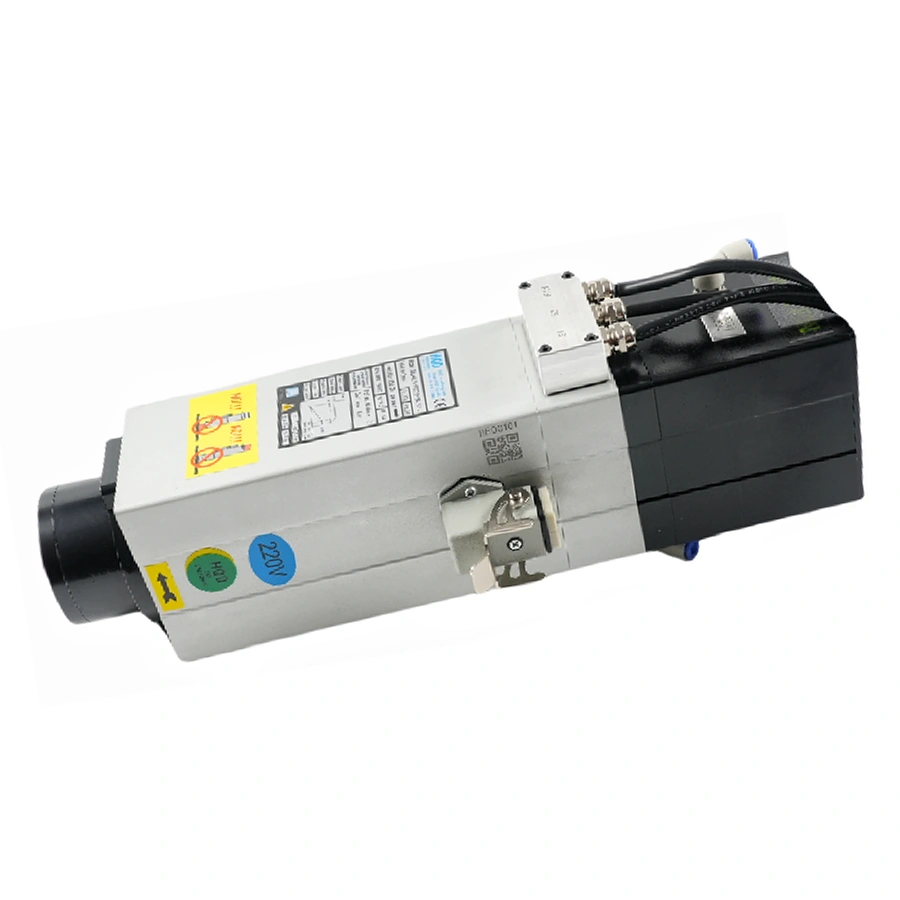
| GDL40.5 ISO20 | 18,000 rpm rated; 24,000 rpm maximum | Read both points on its own curve |
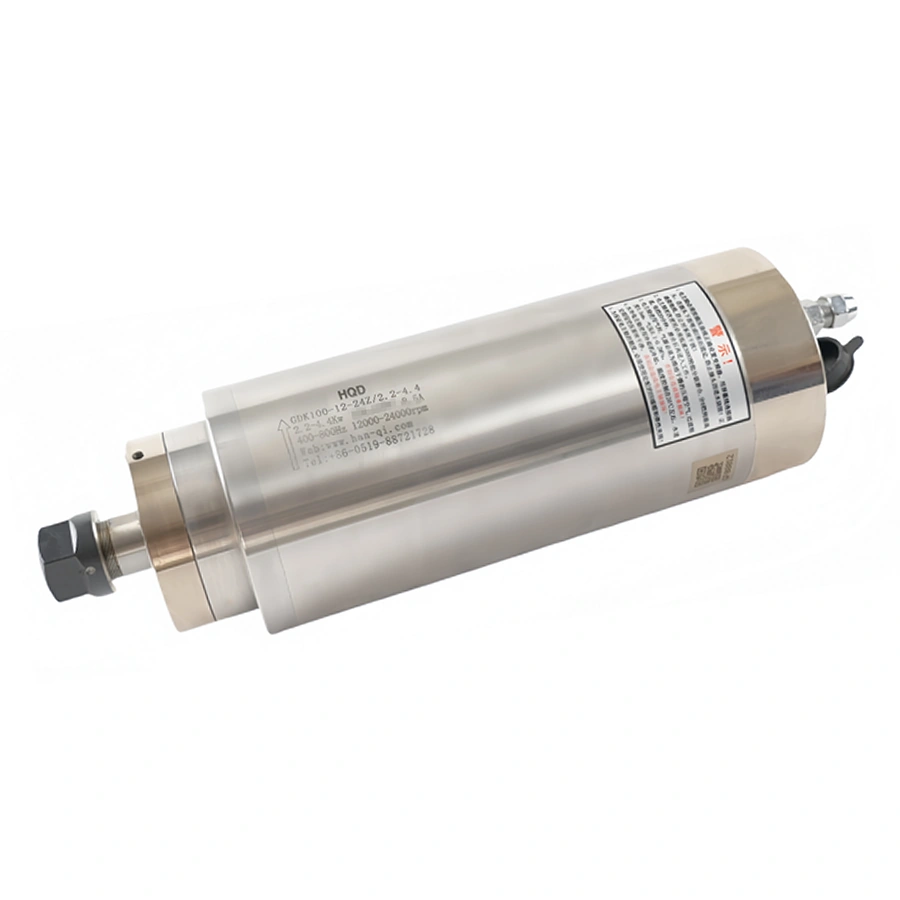
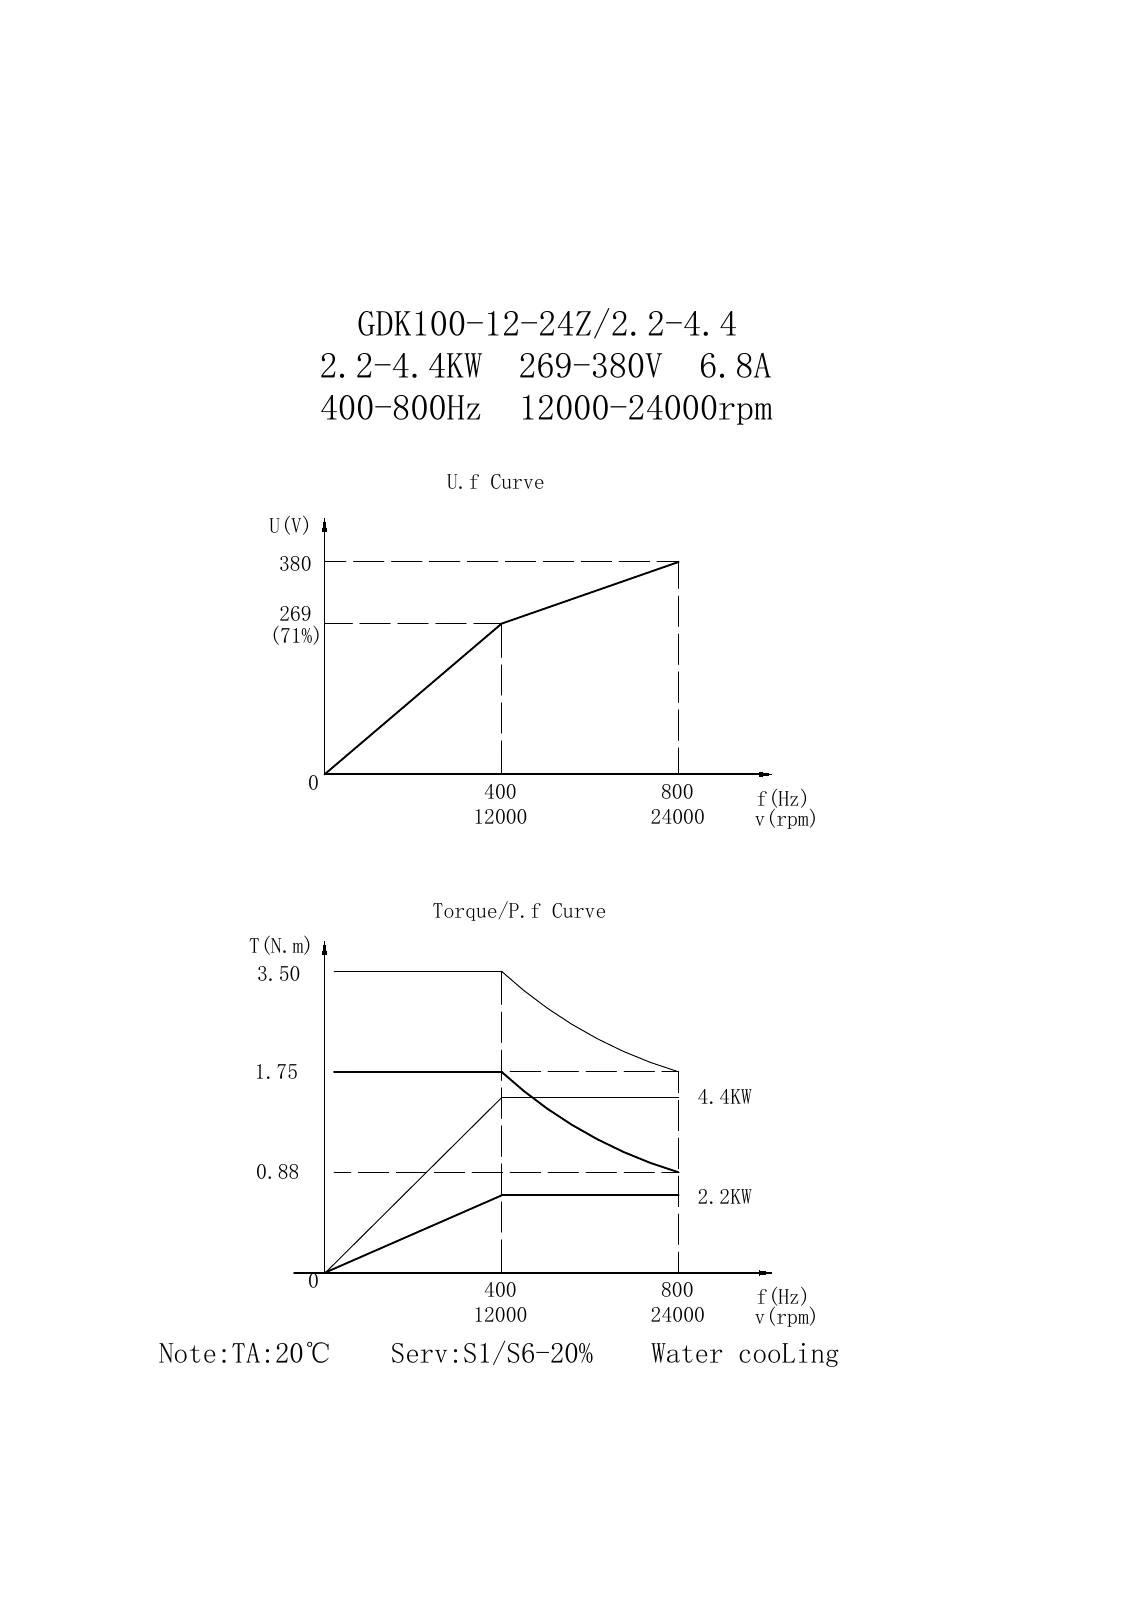
| GDK100 2.2-4.4 | S1/S6-20% at TA20°C | Keep the higher curve with its duty |
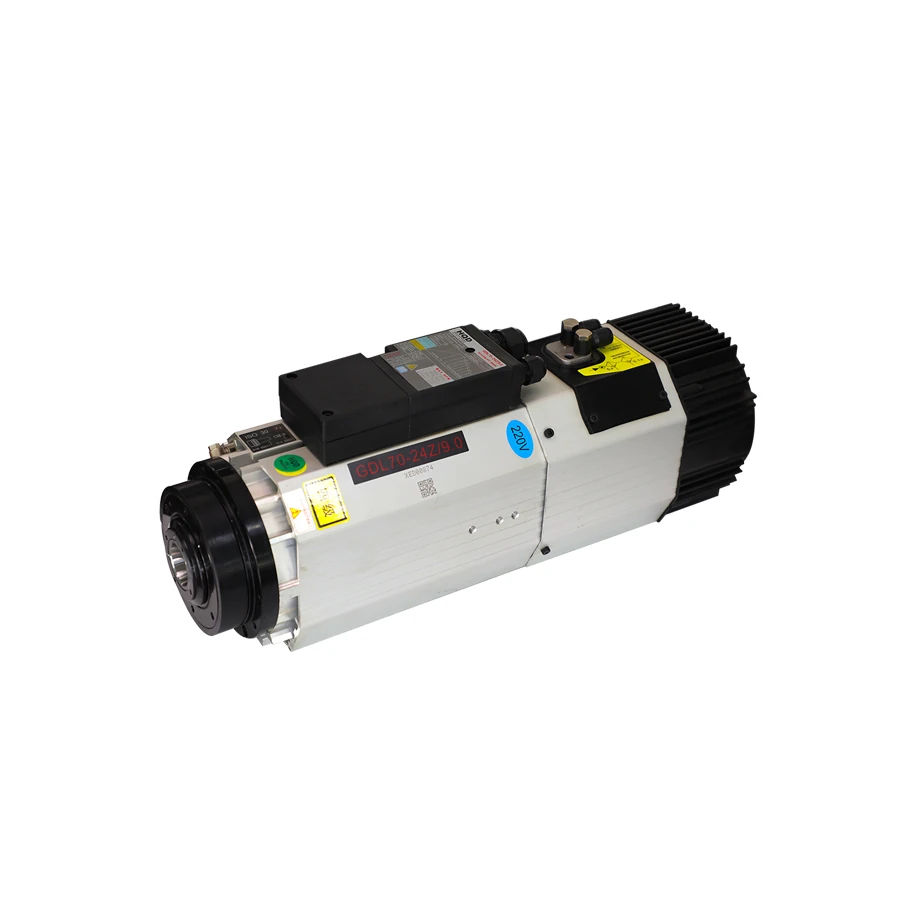
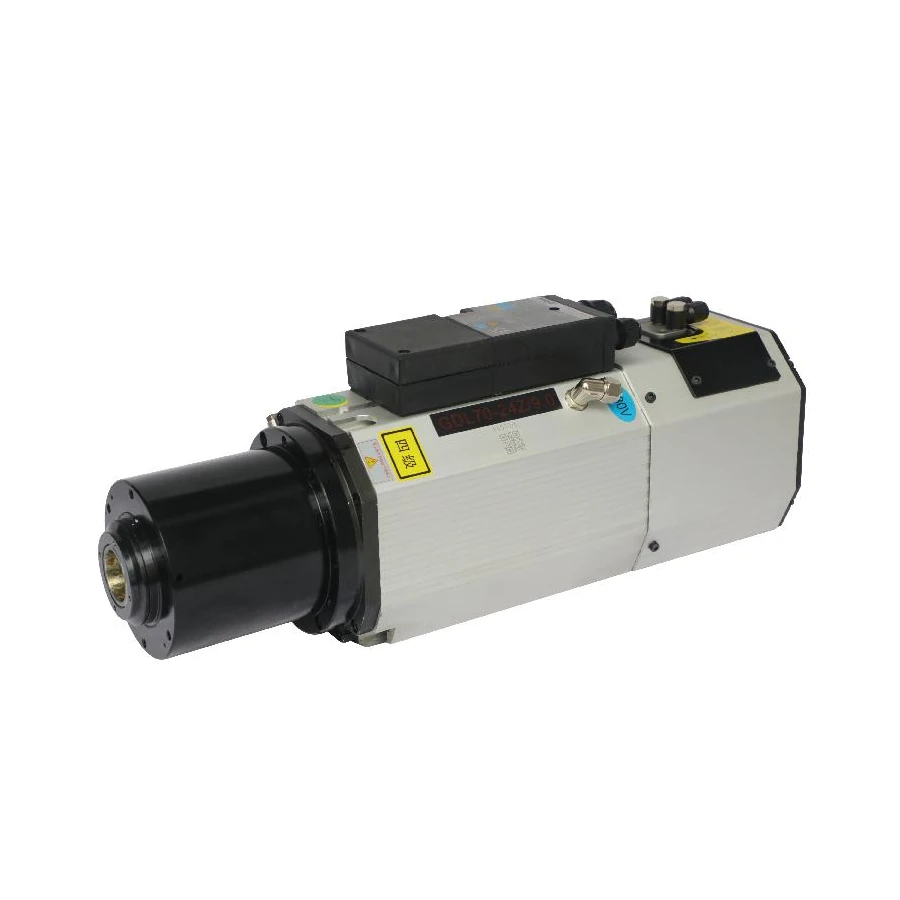
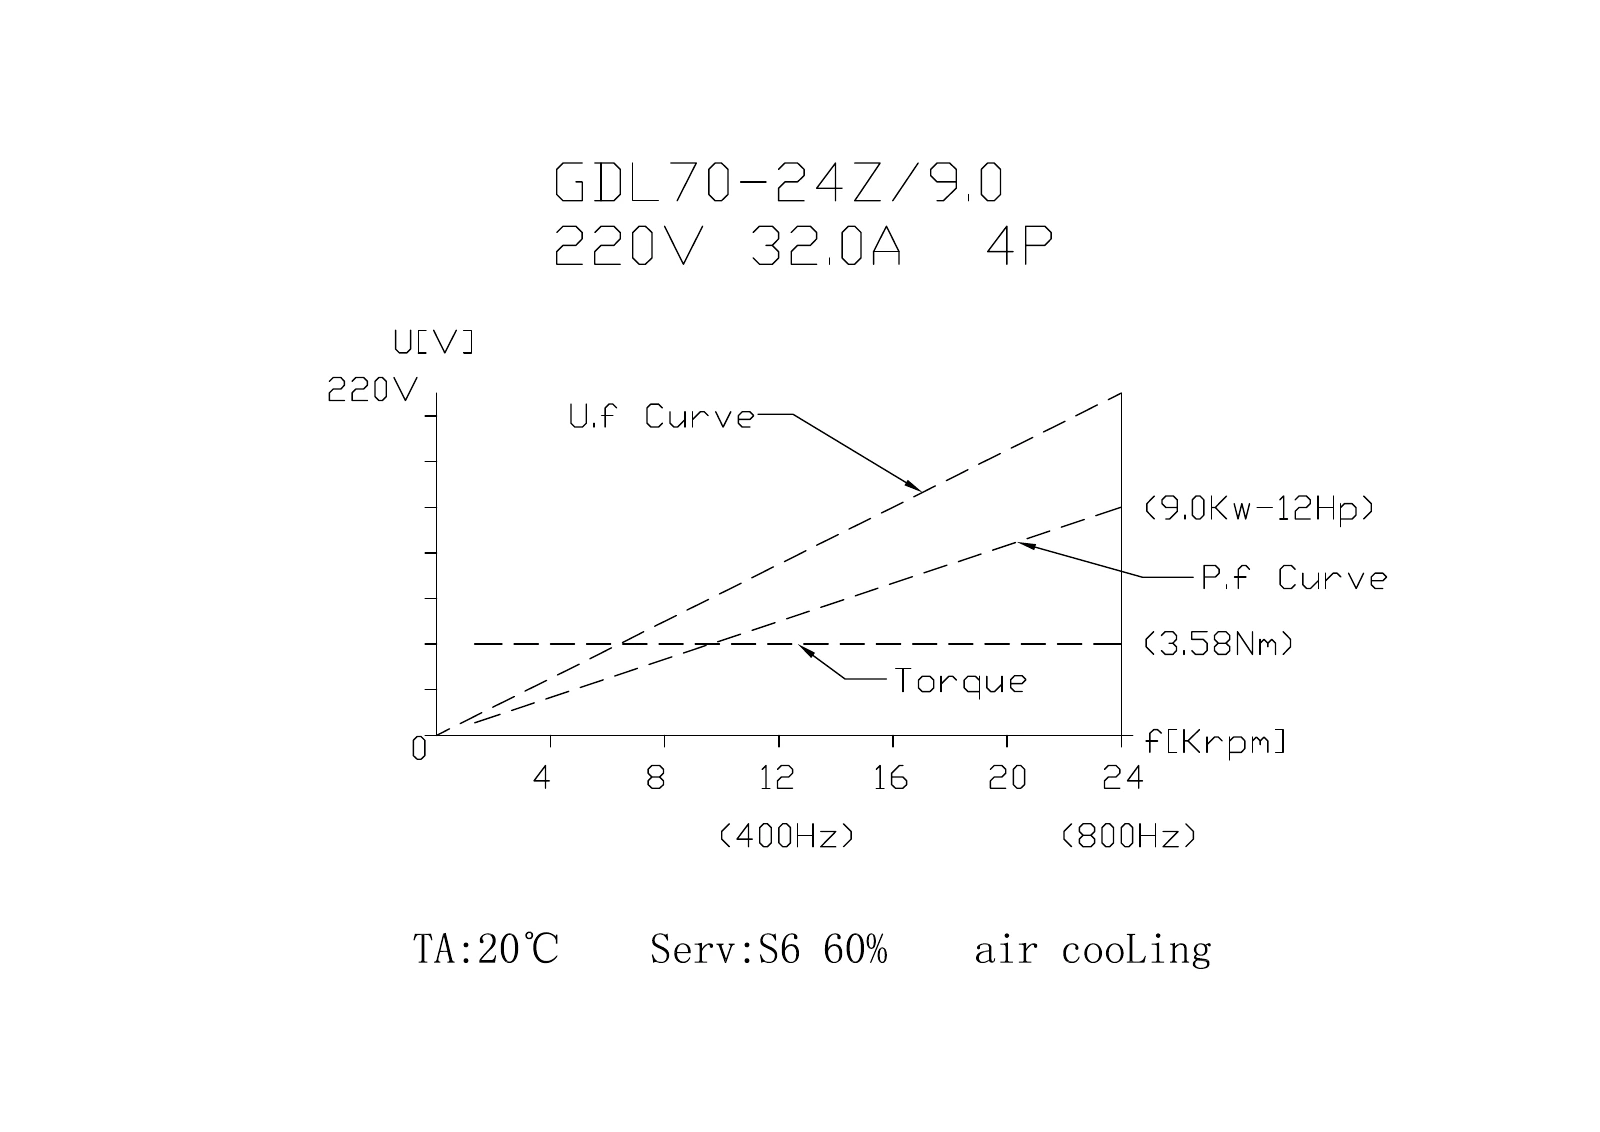
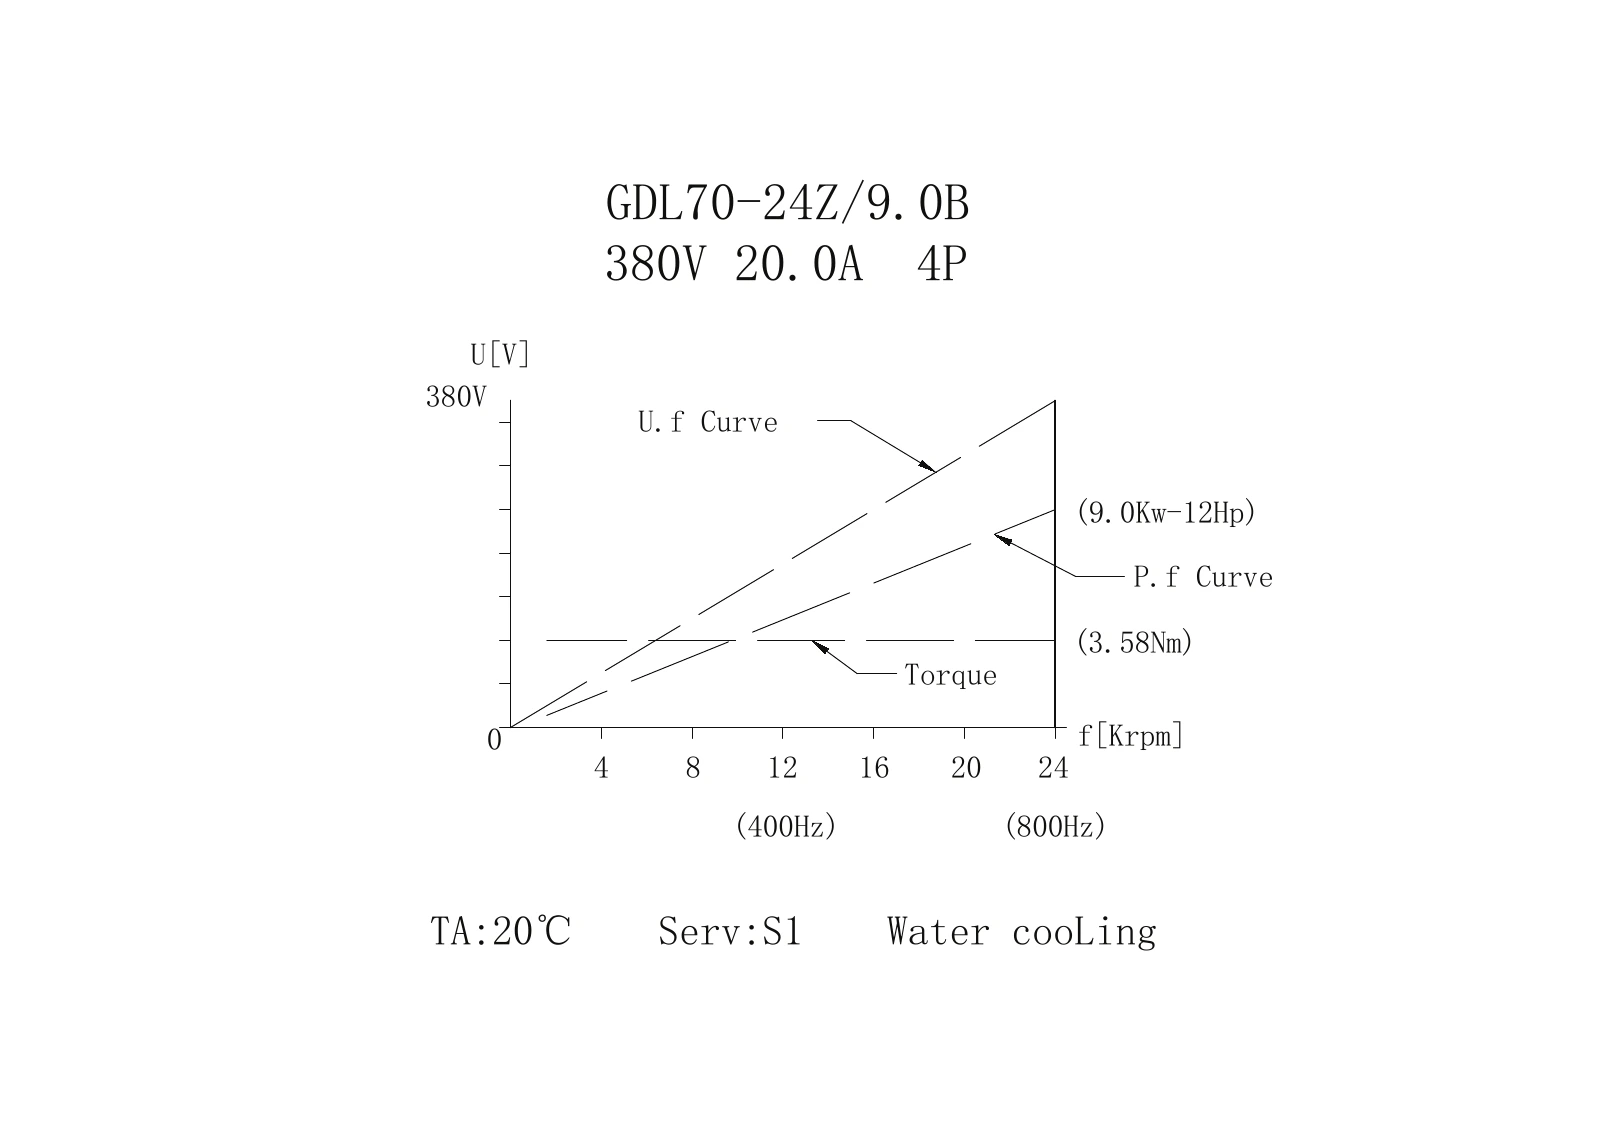
| GDL70 air and water | S6-60% versus S1 at TA20°C | A shared 9 kW label does not establish equal duty |
Start with the actual working point
A useful spindle comparison starts with the speed required by the tool and operation. Add the required load cycle, cooling and installation conditions, then inspect the available power and torque at that point. A motor with a larger headline rating can still be a poor choice if its documented working range, mounting or drive requirements do not fit the machine.
Keep four separate questions in the selection record: what output is documented, at which speed, under which duty, and with which cooling and ambient conditions? This prevents a short model suffix from becoming a claim about continuous output everywhere on the speed range. Use the original drawing alongside the product summary, because a curve can carry conditions that do not fit in a catalog title.
Mechanical output also differs from electrical input. A spindle's output rating is not a complete VFD selection rule, and a drive display is not automatically a shaft-power measurement. Match the supplied winding, current and frequency to the drive specification. Where measured performance is needed, use the machine supplier's measurement method and keep its conditions with the result.
Use the power-to-torque equation at one point
For mechanical power in kW and speed in rpm, torque in N·m is approximately 9,550 multiplied by power divided by speed. Equivalently, power is torque multiplied by speed divided by 9,550. This is a unit conversion relationship between shaft power, torque and rotational speed. It does not create an operating curve where none has been documented.
For example, 2.2 kW at 18,000 rpm gives about 1.17 N·m. The same 2.2 kW at 24,000 rpm gives about 0.88 N·m. Both calculations assume that 2.2 kW is available at the respective point. They do not establish that a different 2.2 kW spindle maintains that power between those speeds, or at a much lower speed.
| Power at the stated speed | Speed | Calculated torque | Meaning of the calculation |
|---|---|---|---|
| 2.2 kW | 18,000 rpm | 1.17 N·m | Matches the GDL40.5 rated-point data |
| 2.2 kW | 24,000 rpm | 0.88 N·m | Consistent with its high-speed constant-power curve |
| 2.2 kW | 12,000 rpm | 1.75 N·m | Consistent with the GDK100 lower S1 curve at this point |
| 9.0 kW | 24,000 rpm | 3.58 N·m | Keep the relevant GDL70 cooling and duty condition |
Use consistent units and sensible rounding. A value calculated from nominal kW is an interpretation of that nominal point, not a laboratory result with greater precision than the source. If the tool requires another speed, return to the curve and obtain the documented power there before calculating torque. Never hold headline power constant by assumption to claim a large low-speed torque.
Separate rated speed from maximum speed
GDL40.5-ISO20-24Z/2.2 has an 18,000 rpm rated point at 300 Hz and a separate 24,000 rpm maximum at 400 Hz. Its drawing gives 2.2 kW and 1.17 N·m at the rated point. The plotted high-speed region keeps power at 2.2 kW while torque falls toward approximately 0.88 N·m at 24,000 rpm.
This is a concrete example of why maximum RPM and rated RPM should remain separate fields. A procurement comparison that lists only 24,000 rpm loses the rated operating point. Conversely, listing 18,000 rpm as the only possible speed ignores the separately documented maximum. Retain both descriptions, and use the curve for the operating point between them.
Below the rated point, the drawing depicts a different power/torque relationship. Read that relationship within the supplied-unit operating instructions; a curve drawn toward zero is not a blanket approval to operate under load at every low speed. Cooling, drive control and permitted operation still apply. The drawing is operating evidence, not a universal minimum-speed rule for every HQD spindle.
Compare constant-torque and constant-power regions
In a constant-torque region, power rises as speed rises. In a constant-power region, torque falls as speed rises. These relationships follow the same equation, but the actual transition belongs to the motor and drive documentation. Do not assign a transition speed from another model merely because both products have the same kW label.
The GDK100 drawing shows its lower curve at approximately 1.75 N·m and 2.2 kW at 12,000 rpm, followed by roughly constant 2.2 kW power through 24,000 rpm and falling torque to about 0.88 N·m. The higher curve depicts 4.4 kW with higher torque. Read those curves with the S1/S6-20% annotation discussed below.
The GDL70 source curves instead depict approximately constant 3.58 N·m with power rising toward 9 kW at 24,000 rpm. That is a different shape from the GDK100 high-speed constant-power region. These two examples make clear why a product range cannot share one assumed torque behavior. Select by the documented point and duty, not by a generic rule about spindle speed.
Read S1 and S6 with the whole cycle
S1 describes continuous duty at a constant load for sufficient time to reach thermal equilibrium. S6 describes a periodic cycle of operation under load followed by operation at no load, with no rest or de-energized interval in that cycle. The percentage describes the loaded portion of the specified cycle. It does not mean that any arbitrary on/off schedule satisfies the rating.
For a mathematical example, if an approved cycle were ten minutes, a 60% loaded fraction would consist of six minutes under load and four minutes operating at no load. A 20% fraction would be two minutes under load and eight at no load. The cycle here is illustrative; neither example establishes the cycle length or load permitted for an HQD installation. Obtain the supplied motor's conditions.
| Duty marking | What it describes | What still needs checking |
|---|---|---|
| S1 | Continuous constant-load duty to thermal equilibrium | Supplied rating, cooling and ambient conditions |
| S6-60% | Periodic load/no-load operation; 60% loaded fraction | Specified cycle, load, no-load condition and installation |
| S6-20% | Periodic load/no-load operation; 20% loaded fraction | Conditions attached to the higher curve and cycle |
| TA20°C | Ambient-temperature condition shown on the drawing | Actual environment and permitted rating conditions |
Duty terminology explains how an operating rating relates to the stated load cycle. HQD's applicable documentation determines the spindle rating. Retain the stated duty and conditions rather than transferring ratings from another motor. Also distinguish ambient temperature from coolant temperature: TA20°C is not, by itself, a chiller setpoint instruction.
Work through the GDK100 2.2-4.4 example
The GDK100-12-24Z/2.2-4.4 source document identifies 12,000–24,000 rpm and 400–800 Hz. Its voltage curve passes through 269 V at 400 Hz/12,000 rpm and 380 V at 800 Hz/24,000 rpm. Those are paired curve points. They are not independent 269 V and 380 V winding options that a buyer can select without the supplied configuration.
The power/torque chart labels 2.2 kW and 4.4 kW curves and states S1/S6-20%, TA20°C and water cooling. Keep the lower continuous-duty curve distinct from the higher cyclic-duty curve. The product is cataloged as 2.2 kW rated; writing 4.4 kW continuous output because it appears in the suffix would erase the duty condition.
At 12,000 rpm the displayed lower torque is approximately 1.75 N·m, and at 24,000 rpm it is about 0.88 N·m. The higher curve depicts approximately 3.50 N·m and 1.75 N·m at those same endpoints. These values explain the chart under its respective conditions. They do not establish how long a machine can use the higher curve during an arbitrary production job.
Ask for the supplied-unit drive and duty instructions when planning operation on the higher curve. Include the intended loaded and no-load sequence, speed and cooling arrangement in the inquiry. This is more useful than asking only whether the motor is 2.2 or 4.4 kW, because both labels appear in the drawing with different operating implications.
Compare the two GDL70 9 kW configurations
The air-cooled GDL70 ISO30 short-nose configuration documents 9 kW at 24,000 rpm with S6-60% and TA20°C. The water-cooled GDL70-24Z/9.0B documents 9 kW at 24,000 rpm with S1 and TA20°C. Both curves show approximately 3.58 N·m, but the duty and cooling conditions differ.
The air example shown in the curve is a 220 V/32 A winding; the water example is 380 V/20 A. Keep each voltage/current pair with its exact document. Other winding choices listed for a configuration require their own supplied specification. A shared ISO30 interface does not establish that the electrical, mechanical and service installation will transfer unchanged.
For production comparison, write the required duty next to the power instead of ranking both as an unqualified 9 kW. Then compare body and mount, overall envelope, spindle mass, holders and cooling services. The short air assembly is 471 mm overall and 26 kg; the water assembly is 483.5 mm and 31 kg. Those mechanical differences remain relevant even after the output requirement has been resolved.
Relate motor frequency to speed carefully
The familiar synchronous-speed relationship is 120 multiplied by electrical frequency divided by the number of poles. For four poles at 800 Hz, the calculation is 24,000 rpm; at 600 Hz it is 18,000 rpm. These relationships help interpret the documented GDL examples. They are not a substitute for the exact motor type, nameplate or control instructions.
For an induction motor, actual shaft speed under load can differ from synchronous speed because of slip. A VFD's frequency display and a calculated synchronous value should therefore not be presented as a measured shaft-speed record. Use the machine's appropriate speed measurement and control information when the process requires an actual value.
Keep the spindle's electrical operating frequency separate from the frequency of the incoming machine supply. The VFD converts that supply into the output required by the motor, subject to its documented capabilities. Verify the required output voltage, current and frequency together with the supplied winding and motor data. Use the exact drive manual and spindle connection drawing to establish parameters and wiring, and identify any separately powered fan, sensor or release circuits. Settings and terminal assignments from another motor or drive do not establish a suitable configuration for the proposed unit.
Check a requested point against the curve
Suppose an inquiry requests continuous 2.2 kW at 12,000 rpm. The conversion equation gives approximately 1.75 N·m at that point, but the required evidence is still a curve showing continuous 2.2 kW there. The GDK100 lower curve provides a documented example at that speed. A different 2.2 kW model rated at 24,000 rpm should not be assumed to provide the same point without its own operating data.
Now suppose the request changes to 4.4 kW at 12,000 rpm. The calculated torque is approximately 3.50 N·m, consistent with the higher GDK100 curve. The inquiry must also change its duty question: the higher curve is associated with S6-20%, not an unqualified continuous 4.4 kW rating. Send the intended load/no-load cycle and installation conditions for confirmation, rather than using the calculation to remove that condition.
Finally, suppose the request is 9 kW continuously at 24,000 rpm. The water-cooled GDL70 B source curve has an S1 annotation, while the air-cooled example has S6-60%. This makes the water configuration relevant to the continuous-duty comparison, subject to its specified ambient, cooling and supplied-unit conditions. It does not mean every other installation requirement has been met.
Document the outcome in three fields: requested point, source evidence, and remaining installation checks. That small discipline makes discussions about torque precise and prevents a correct equation from supporting an incorrect purchase. A calculation can check consistency; the curve and supplied operating instructions establish the motor's documented conditions.
Build an engineering comparison you can reuse
Create one row per candidate with exact code, winding, working speed, documented power at that speed, duty and cooling. Add the mount, mass, tooling and any evidence gap. This lets a procurement team distinguish a complete candidate from a product whose headline rating looks suitable but whose operating conditions remain unresolved.
For an existing process, retain representative cycle information: periods under cutting load, periods operating without load, commanded and observed speed, tool changes and cooling conditions. Have the machine supplier interpret those records against the spindle documentation. A momentary successful cut does not demonstrate thermal acceptance for the planned production cycle.
When the cutter and engagement require a lower working speed, identify the power and torque documented at that speed and retain the relevant duty, cooling and ambient conditions. Check the tool's permitted speed and projection against the machine's feed and workholding capability. For an ATC installation, add the exact holder taper, retention components, rack geometry, release services and state signals to the same review. Complete the comparison only when the operating point, tooling and machine integration requirements are supported by applicable documents, and record unresolved conditions before finalizing the purchase.